
Lesson · 4 min Steady
Misleading Charts
In one line Check the axis, the start date and the scale before you trust how steep a chart looks.
A chart is a claim drawn as a picture, and the picture can exaggerate. A truncated axis starts the vertical scale above zero, so a small change looks huge. A bar that seems to double might rise from 98 to 100.
Other tricks: a time window chosen to show a rise; two scales on one chart that make unrelated lines seem to move together; cumulative totals that can only climb, even when each month gets worse.
The habit is to read the numbers, not the shape. Look at where the axis starts, what the time range is, and whether the units match. Then ask what the chart would look like with the full scale.
The membership poster

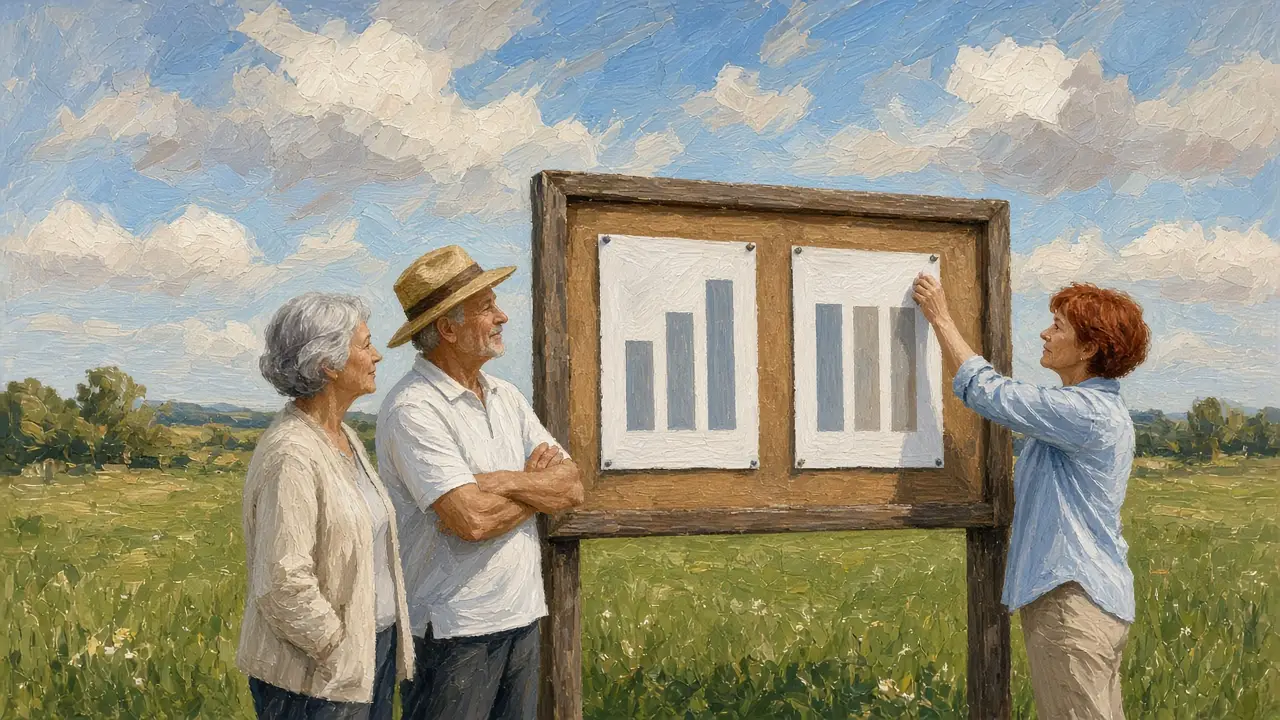
A sports club poster shows its membership soaring. The bars look like they tripled. Sana reads the axis: it starts at 960 and ends at 1,000. Membership rose from 970 to 990.
She redraws it with the axis from zero, and the bars look almost the same. The change is real but small, about two percent. The poster had used scale to tell a bigger story than the numbers did.
Try this today Next chart you see, read the first and last number on the vertical axis before anything else.
Cite or share this lesson
A plain reference you can paste into notes or an essay:
Quest2Reason. “Misleading Charts.” https://quest2reason.com/learn/lesson/misleading-charts. Accessed 13 November 2026.
Sources
- Darrell Huff, How to Lie with Statistics (1954), chapter 5, “The Gee-Whiz Graph” — The truncated axis and other ways a true number is drawn to mislead. Paraphrased; nothing is quoted.
- Wikipedia, “Misleading graph” — Truncated axes, dual scales and other distortions.